VRoom! blog - faster still!
18 Feb 2023Introduction
Last week we announced a new Dhrystone number 7.16 DMips/MHz at an average ~2.8 IPC (instructions per clock) - we keep quoting DMips/MHz because it’s a great number for measuring what a particular architectural implementation can do. IPC is more specific it tells us something about how our particular architecture is doing - in our case we can peak issue 8 instructions per clock (if we have no branches and all RISCV C (16-bit instructions), of course real instruction streams don’t do this - on Dhrystone we measure on average ~3.5 (out of 8) instructions per 16 byte bundle. VRoom! can also retire a peak of 8 instructions per clock (this is limited by the number of write ports in the architectural register file) the average IPC numbers we quote is the average of the number of instructions retired per clock.
Our IPC clock number is actually slightly low as a small number of instructions (mostly no-ops and unconditional branch instructions) don’t make it past the decode stage, and so never get ‘retired’.
Micro-architectural Tools
Our major microarchitectural tool has been a simple trace, it logs instructions entering commit buffers, their execution and their retirement - it’s great for debugging pipe problems and particularly pipe wedges.
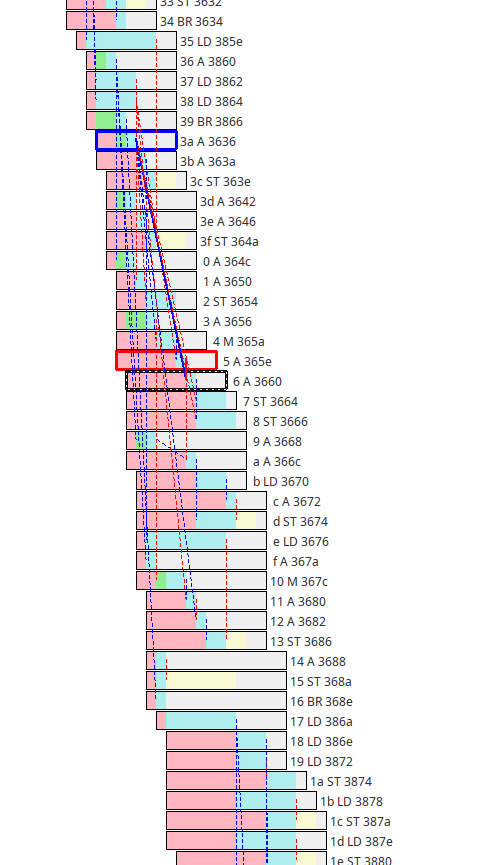
What it doesn’t do is give us a lot of insight into when and why individual instructions wait in the commit Q. Now we have a new tool for exploring the pipe:

Each box represents an instruction, to the right is the commit Q index, the functional unit and the PC. Instructions that align on the left were issued in the same clock (ie come from the same 16-bit fetch bundle) instructions that align on the right are retired together (we never retire out of order, things retired together are committed together).
We can click on any instruction and see it hilighted (black), the instructions it depends on also get hilighted (red and blue). Clicking back in time we can explore dependency chains.
Within each instruction we can explore why it’s being delayed, pink means it’s waiting for other instruction’s to complete. Green means we’re short of functional units, blue means we’re executing, yellow is for store instructions (which can start executing when the address is ready but wait for the store data to come along), gray just means an instruction is done and it’s waiting for to be committed (an instruction can’t be committed until all the instructions ahead of it are committed).
This is great - but it doesn’t (yet) show load/store dependencies - in our new load/store units load instructions and store instructions get put into a temporary space if there are load/store instructions ahead of them in the instruction stream for which we don’t yet known the address. We allow accesses to different addresses to pass each other in the store and execution queues, but until we know all the addresses we have to wait.
What are we waiting for?
It turns out that resolving those low level memory dependencies is important, more importantly there’s a 3rd issue - we can issue 8 instructions per clock, and retire 8 (if they’re done) but have a 32-entry commit Q - that means that really there are only 16 effectively active entries in the middle of the queue.
We have 32 entries in out commit Q because we couldn’t fit any more into the AWS FPGA test environment, we’d always expected to increase this to 64 or 96 entries (all those comparable big CPUs in the field tend to have something of the order of 1-200 instructions in flight at a time so we’d always expected to increase this) - by doubling the size of the commit Q we give more things time to finish without causing stalls - with a 64 entry commit Q we can have ~150 instructions in flight at a time (including the store Q).
The results are great, better than we expected: For Dhrystone our previous 7.16 DMips/MHz expands by ~22% to 8.71 DMips/MHz - 3.39 IPC. That’s pretty amazing - we know that Dhrystone, as we’ve compiled it for RISC-V, issues instructions at an average of 3.52 instructions per 16-byte bundle (per clock) - since we can’t retire more than we issue that means we only have about 4% more we can get from the execution unit, for this workload they’re pretty well matched.
Note: there’s a lot of green in some parts of the above trace (and even more in other places), which implies that we might perform better if we have 4 rather than 3 ALUs (‘green’ means an instruction is waiting for an ALU). We did do that experiment, but it turns out that, like last time we tried it, the performance is identical (to the same number of clocks), even though the 4th ALU gets a lot of use there’s enough slack in the larger commit Q that instructions get shifted in time but end up being retired at the same rate. So we’ll stay with 3 ALUs for the moment, if we build a 2-way SMT version we’ll likely need to increase this to at least 4.
Of course Dhrystone is just one benchmark, and we’re pretty much done working on it, time to try something different. It may also be a good time to revisit a trace cache (which will up the issue rate of inner loops, and since Dhrystone is effectively perfectly predicted should up the issue rate to 8 instructions per bundle).
Next time: More misc extensions
