VRoom! blog - one more clock
24 Feb 2023Introduction
Over the past few weeks we’ve announced a bunch of new VRoom! incremental performance increases, this week we found another
To recap
One of the fixes we’d found a couple of weeks ago was able to pull in an extra clock from the load data path - essentially our commit Q entries predict when an instruction will be completed a clock before the data becomes ready, this way the instructions that use that output can be scheduled a clock ahead. That bought us a 6% dhrystone performance bump.
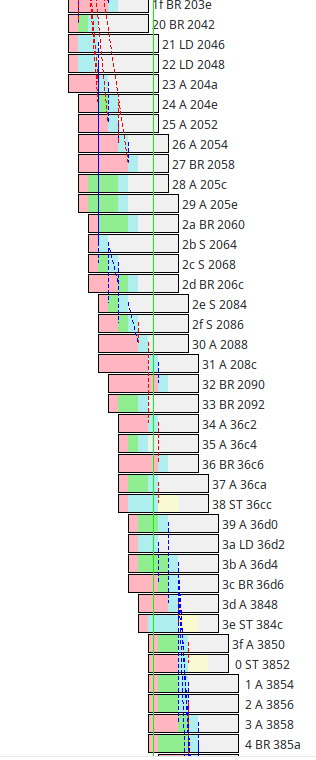
We also increased the depth of the commit Q, something we’d always planned on doing - bumping it from 32 entries to 64 bought us another ~22% - you can see it here in trace below from dhrystone, along the green vertical cursor there are 35 active entries (more than half the 64 commit Q size) - in addition there’s a lot of green in the boxes - that indicates instructions waiting for ALUs to become available, that’s a good thing, as we reported last time increasing the number of ALUs from 3 to 4 has no effect here, but the longer commit Q gives the pipe more leeway to move instructions in time to make better use of the 3 ALUs we do have, without affecting performance.

Another Clock ….
Bruce Hoult introduced me to a benchmark of his, it’s based on primes which makes it a great test of branch predictors, not so much about how good they are because no one makes branch predictors to predict primes (if we could that whole P vs. NP thing would be moot), more it’s a test of what happens when branch predictors fail. In our case it shows our miss cost, ameliorated by the fact that sometimes we can resolve a missed branch high in the commit Q (because we execute instructions out of order) and refill it before it empties.
One thing I noticed in this benchmark is that it does one of the worst case things, a load followed by a (possibly mispredicted) dependant branch, that sort of latency tends to slow a CPU’s pipe to a crawl. Terrible if you find it in your program, but as a benchmark it’s excellent because we can look at it and see if there’s anything here we can do to make things go faster …..
In this case it appeared that that previous load clock bug I’d found and fixed didn’t really apply, turns out there a path there which could also be tightened up, it’s an interesting one because it’s all tangled up in the logic that handles restarting mispredicted instructions …. it’s the sort of logic you can’t compile into synchronous logic because it has circular feedback paths in it.
However it turns out that one can tease apart the load completion logic and the “instruction is being killed” logic and effectively speculatively complete the load, knowing that if the load instruction is going to be killed anyway there’s another mechanism that going to do that a clock later, before the instruction is committed - the part of the logic this was entangled with also stops a store Q entry being allocated for a killed instruction, that still needs to happen, but now it’s unrelated.
(by ‘killed’ here we’re talking about the instructions following a mispredicted branch or a trap that need to be cleared from the commitQ in order to restart the instruction stream)
So we got one less clock on a lot of instructions - how much faster is dhrystone now? The answer is none, 0%, no faster at all. As we mentioned last week at this point dhrystone’s performance on VRoom! is essentially limited by its issue rate (the speed that the front end can decode and issue instructions, and that’s limited by the branchy nature of the benchmark. We issue bundles of instructions on 16-byte boundaries, so we can issue up to 8 instructions per clock if they’re all 16-bit instructions and 4 if they are 32-bit (we’re operating on a mixture), also whenever we branch into the middle of a 16-byte bundle, or out of the middle of one we have to ignore the instructions not executed. Dhrystone is pretty ‘branchy’ it loses a lot to these issues - currently we see an issue rate of 3.58 instructions per clock (max would be 8).
A while back we made an attempt to up issue rates by creating a trace cache (a level 0 virtual i-cache that holds decoded instructions), that experiment was a bit of a failure, now that we’re starting to become issue limited it’s probably worth reopening that particular can of worms ….
And possibly yet another Clock ….
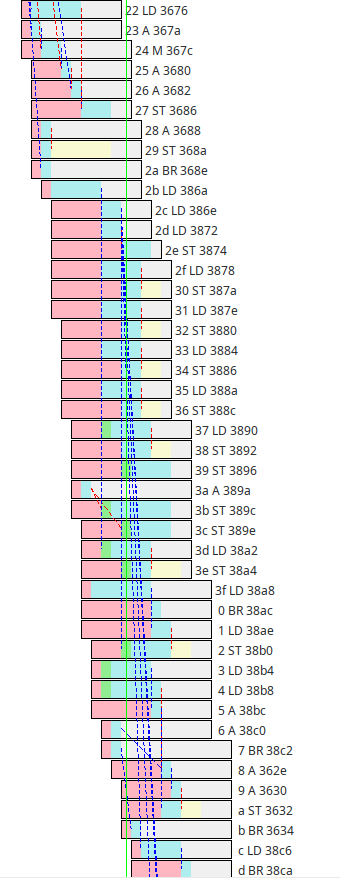
Here’s another trace from dhrystone:

It’s another case where the commitQ is pretty full - the interesting stuff starts at the top, there’s a “2a BR 386a”, that’s a subroutine return followed by an indirect load from the GP. The address read from there is then used as base address for another load and then those two addresses are then used as the base addresses for a sequence of load/store pairs.
The load/store unit is getting a great workout there, at times issuing 6 instructions/clock (for address processing) and 4 each load/stores per clock (those vertical red dotted lines are the data moving), what’s not so obvious is that there are load instructions there where the blue portion is not 2 clocks wide … that means that they are waiting for store instructions ahead of them for which we don’t yet know the address of (and therefore can’t yet be entered into storeQ), because we don’t know the (physical) address these instructions will store to, the following load instruction can’t bypass them in time because they might alias (ie the store instruction might change the data the load instruction is trying to load).
Anyway looking at this closely we suspect that there might be an extra clock here for the case where when the store resolves but the addresses don’t alias (when it does alias the load has to wait until it can snoop the stored data from the storeQ).
However even if we hunt down this clock (it’s likely going to be a difficult timing path) benchmarked performance likely won’t increase for all the reasons we’ve explained above.
The core instruction retirement rate here is also strange - it’s retiring 8 instructions per clock every other clock (2f-36, waits a clock, the 37-3e, waits a clock, 3f-06, waits a clock, 07…), which is a bit strange and worth spending some time with.
Next step is going to be to build some more visualization tools to represent these relationships along side the existing pipeline tool, there’s likely more subtly to understand.
Next time: More misc extensions
