VRoom! blog - Trace Cache Redux
11 Mar 2023Introduction
Last week we found some Dhrystone performance we’d left unreported from when we had implemented the B instructions, but largely for a couple of months now our performance has been limited by the issue rate in the fetch/decode stages, in Dhrystone this is limited by the branchy nature of the instruction stream.
This week we resurrected our broken trace cache and got a further 5% performance (now at 10.3 DMips/MHz)
Trace Cache
Last year we spent quite a while building a simple trace cache for VRoom! the experiment was successful in the sense that it actually worked, but not so much because its performance sucked, it never performed better than not having a trace cache.
So what is a trace cache in this context? essentially it’s a virtually tagged cache of already decoded instructions recorded from the spot in the CPU where we retire instructions - in particular it’s a recorded stream of post branch predictor instructions - our trace cache is 8 instructions wide and is capable of feeding fully 8 instructions per clock into the renamer.
As mentioned above our previous experiments of creating a simple trace cache sucked, mostly that was because it interacted badly with the branch target cache (BTC) - when we use the BTC alone Dhrystone is predicted perfectly, when we mix it with a trace cache we see mispredicted branches and the associated performance drain.
Performance
So now that we’re in a position where we’ve been improving the execution side of things for a while, but not the issue side of things, so it was worth revisiting the broken trace cache, to our surprise it performs better than not having it now - we now see ~10.3 DMips/MHz which is ~5% faster than last week’s numbers - even with the broken trace cache taking mispredicted branches.
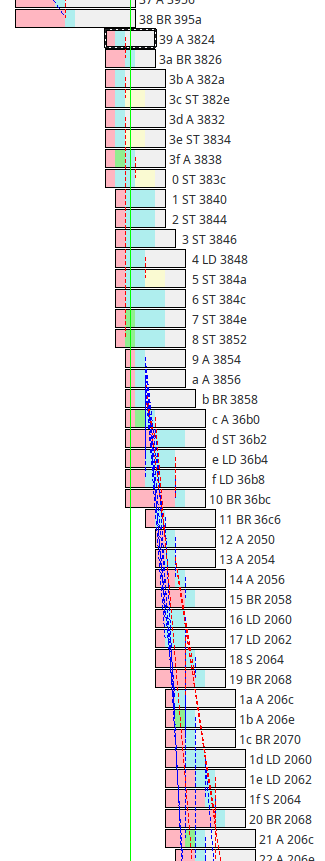
Here’s a great example trace from the middle of Dhrystone:

Note that it starts with mispredicted branch, but after that we see a bunch of mostly full feeds from the trace cache - runs of 8 instructions all starting on the same clock.
In fact we measure an issue rate of 6.2 instructions per clock over the benchmark (previously we were getting ~3.7) sadly though, many of those are being discarded by mispredicted branches (which flush all the instruction after them in the commitQ when they resolve), our final IPC (instructions per clock, which is a measured after branch prediction, a count of actual instructions completed) is now at 3.77 (out of 8) - our design goal has always been 4 on sustained streams, that we’re getting this close on a branchy benchmark is pretty amazing!.
What’s Next?
It’s pretty obvious that we need to fix the trace cache and up the issue rate - next step is likely to be to have the BTC learn to predict whether a trace cache hit should be followed or not
Next time: More trace stuff

