07 Mar 2023
Introduction
This week we’ve done some more experiments in macro op fusion, and found an unrelated
surprising performance boost - ~12% to 9.76 DMips/Mhz - almost at 10!
Limits
A reminder from last time, we’ve set some limits on our macro op fusion experiments:
- we’re going to avoid creating new instructions that would require
adding more read/write register ports to ALUs
- we’re also going to avoid (this time around)
trying to deal with instructions where the second of a pair might fault and not be executed.
For example if we fuse ‘lui t0, hi(xx);ld t0, lo(xx)(t0)’ the load might take a page fault
and get restarted expecting the side effect of the lui had actually happened - it’s not that
this can’t necessarily be done, just that this is hard and we’re performing a simple experiment
Choices
Last time we merged return instructions and preceding add instructions, and constant loads and compares.
This time around we’ve add 4 more optimizations: merged lui/auipc instructions and add instructions, and lui instructions and load/store instructions. These are the ‘traditional’ candidates for fusion.
Planning ahead for this we’d previously plumbed 32-bit constants everywhere through our design, up until now
they’ve either been high 20 bit lui/auipc values or low 12-bit signed constants. Now we’ve added logic to
combine these values - if we limit merging to constants that the decoder actually makes then it doesn’t
require a full 32-bit adder per renamer (7 of them for 8 renamers
to merge the data between two adjacent units) instead the lower 12 bit just get passed and the upper 20 bits
have an optional decrementer. We share this logic for the 4 newly merged instructions.
The new 4 instructions pair we’re supporting are:
1)
lui	a, #hi(X)
add	a, a, #lo(X)
becomes:
2)
auipc	a, #hi(X)
add	a, a, #lo(X)
becomes:
3)
lui	a, #hi(X)
ld.x	y, #lo(X)(a)
becomes:
lui	a, #hi(X)
ld.x	y, #X(x0)
4)
lui	a, #hi(X)
st.x	y, #lo(X)(a)
becomes:
lui	a, #hi(X)
st.x	y, #X(x0)
Some notes:
- as per last time nops get swallowed in the commit stage
- the new auipc created in 2) gets the pc of the original pc
- load/store instructions still perform the lui (so that exceptions can be restarted, it doesn’t
break the second limitation above), but can run a clock
earlier because they don’t have to wait for the lui - we may remove this limitation in the future
Like previous optimizations this doesn’t affect Dhrystone numbers at all, particularly because
Dhrystone doesn’t use any of these in its core. Nothing surprising here …. however ….
However this week we also did some ‘maintenance’. We’d been using an old library for our benchmarks,
but a few weeks back we switched to supporting the B and K RISCV architectural extensions, the B
extension in particular contains instructions designed to help with string processing and strcmp
is a core part of Dhrystone, this week we upgraded the library to use the new libraries, we also optimized
them for VRoom! (mostly this involved aligning code to 16-byte boundaries).
The results have been better than we expected - a 12% increase in Dhrystone numbers, 9.76 DMips/MHz - a
better number than we’d previously assumed possible without a trace cache - we’re
now seeing an IPC of 3.58 (max 8) and an issue rate of 3.66 (out of 8). In the future with a functioning
trace cache (and a n issue rate close to 8) we can predict that the max performance could be
in the ~20 DMips/MHz range (assuming that
our execution side improvements keep up, at this point they’re already ahead a bit).
So excellent news, not from recent changes, but essentially due some of the changes due to updates a month or so ago that had not fully been counted yet.
Next time: More misc extensions
05 Mar 2023
Introduction
Spent some time this week experimenting with macro op fusion. Many of the
arguments around the RISCV ISA have been addressed with “you can solve that
with macro op fusion” which is the idea that you can take adjacent instructions,
next to each other, in an instruction stream and merge them into a single instruction
that by itself can’t be expressed directly in the instruction set.
We’ve always planned that VRoom! would support fusion that made sense in the
renamer stage (post decode) - today’s work is a trial experiment fusing some
common sequences just to get a feel for how hard they are to implement.
Limits
First some limits:
- we’re going to avoid creating new instructions that would require
adding more read/write register ports to ALUs
- we’re also going to avoid (this time around)
trying to deal with instructions where the second of a pair might fault and not be executed.
For example if we fuse ‘lui t0, hi(xx);ld t0, lo(xx)(t0)’ the load might take a page fault
and get restarted expecting the side effect of the lui had actually happened - it’s not that
this can’t necessarily be done, just that this is hard and we’re performing a simple experiment
Choices
We decided to choose 3 simple instruction pairs, these occur reasonably often in instruction streams
and because they involve fused branches and ALU operations they particularly work well with
our change a while back to merge our ALU and branch units, the downside is that previously
it was possible to build ALUs which shared the adder used by normal addition operations
and the magnitude comparator used for branches, now we will need to be able to do both at once.
The first choice is to merge an add immediate, or an add to x0 instruction, and an indirect branch that doesn’t
write an output register, this catches a whole bunch of common code that happens at the end
of a subroutine:
add	sp, sp, 40
ret

li	a0, 0
ret

mv	a0, s0
ret
The one limitation is that the destination of the add must not be the indirect register used by the jump/ret.
The second and third choices marry a load immediate to a register (add immediate to x0) instruction and a conditional
branch comparing that register with another into one instruction
li	a0, #5
beq	a0, a1, target

li	a0, #5
beq	a1, a0, target
becomes:
li      a0, #5;beq	#5, a1, target

li      a0, #5;beq	a1, #5, target
This mostly means the branch instruction runs one clock earlier, which makes no difference in
performance if it
is correctly predicted (a predicted branch just checks that it did the right thing and
quietly continues on), but reduces mispredicted branch times by effectively 1 clock.
All 3 optimizations free up an ALU slot for another instruction.
Implementation
We perform this optimization in our renamer - remember we have 8 renamers renaming up to 8 decoded
instructions from the previous clock. We add logic to each renamer unit to recognize the types of
addition operations we want to recognize for the first instruction, and pass that information to the
next renamer (the first renamer gets told “no instructions match”).
Each renamer also recognizes the second instruction of the pair and gates that with the match from the
previous renamer in the chain. Care is taken to make logic paths that do not go through the full
layer of renamers.
If a renamer matches a branch (and a previous add) then it modifies the ‘control’ field (the portion
that describes when sort operation is being done, it also tags itself as now creating an output register
(and tags the addition’s output register), it also copies the immediate portion of the addition
and the source register (in the ret operation case which it fetches as rs2).
If a renamer discovers that it’s feeding an add to a fused pair then it marks itself as not creating
an output (doesn’t write a register), this effectively makes it a no-op, the commit stage
will mark this instruction as done and it will never be scheduled to an ALU. The renamer logic
already contains a layer that packs down decoded instructions, if we used that to remove this instruction
it would create circular logic that wouldn’t be synthesisable, If we removed this in the next stage
(added a ‘pack’ layer to the logic that feeds the commitQ) it would be very expensive and would
break the renaming (which renames to future commitQ locations) - so instead we create a no-op
entry (but see below).
The actual implementation in the ALU is pretty simple, we have to allow for a r2+immed addition
and for immediates to be fed into the branch comparator.
Further optimization
You likely noticed that we can’t optimize add/branch pairs that cross instruction bundle boundaries (the boundaries in the instruction stream that our 4-8 instruction decoder decodes from). Once we implement
a trace cache instruction streams will be presented to the renamer again, each time they are replayed,
if such a split instruction pair is presented again here they can be re-optimized.
If we’re running a trace cache we can also purge no-op instructions from the cached instruction stream
as it’s filled.
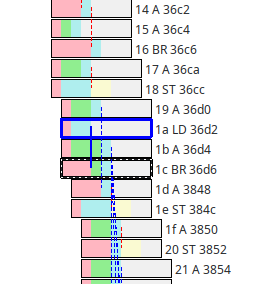
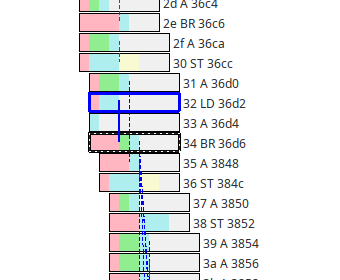
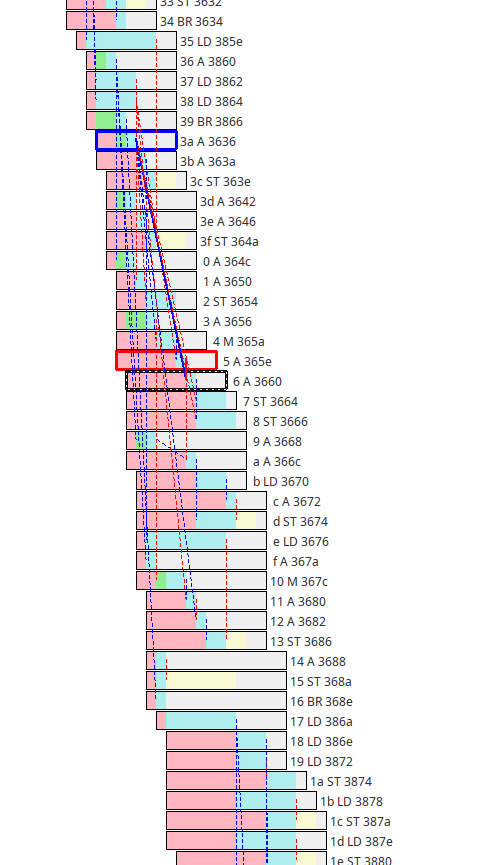
Here’s a simple example of an add/ret optimization, before the return (in black)

and after:

Notice that the add (at 0x36d4) is nullified, all that green in the instructions around there
means that the ALUs are busy so removing one helps. Those blue dotted lines coming down out of the
add instruction (dependencies on the new SP) now come out of the branch (return).
So we know it’s working - how much faster is it on our favorite dhrystone benchmark? Like last time it makes no
difference at all - at the moment on that benchmark our performance there is completely limited by the issue
rate from the instruction fetch/decoders.
We actually don’t expect these optimizations to help dhrystone much anyway as all it’s branches are
predicted, and the big advantage of executing branches early is that it speeds up mispredictions. However
it will also speed up instruction streams that are ALU bound as it frees up a slot.
Any design is a balance between the decode rate and the
rate that the decoded instructions are executed, that balance is going to change with different
sets of code.
Essentially our current bunch of changes, and last week’s, are building pressure on the execution side
of that trade off, we can’t easily speed up the decoder but we will return to our trace cache design
which should be able it issue 8 instructions/clock to support that we’ll need more execution capability.
Next time: More misc extensions
24 Feb 2023
Introduction
Over the past few weeks we’ve announced a bunch of new VRoom! incremental performance increases,
this week we found another
To recap
One of the fixes we’d found a couple of weeks ago was able to pull in an extra clock
from the load data path - essentially our commit Q entries predict when an instruction will be completed a
clock before the data becomes ready, this way the instructions that use that output can be scheduled
a clock ahead. That bought us a 6% dhrystone performance bump.
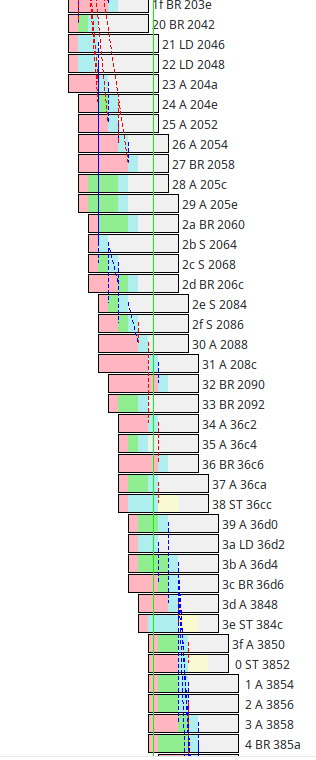
We also increased the depth of the commit Q, something we’d always planned on doing - bumping it from 32 entries to 64 bought us another ~22% - you can see it here in trace below from dhrystone, along the
green vertical cursor there are 35 active entries (more than half the 64 commit Q size) - in addition there’s a lot of green in the boxes - that indicates instructions waiting for ALUs to become available,
that’s a good thing, as we reported last time increasing the number of ALUs from 3 to 4 has no effect here,
but the longer commit Q gives the pipe more leeway to move instructions in time to make better use
of the 3 ALUs we do have, without affecting performance.

Another Clock ….
Bruce Hoult introduced me to a benchmark of his, it’s based on primes which makes it a great test
of branch predictors, not so much about how good they are because no one makes branch predictors
to predict primes (if we could that whole P vs. NP thing would be moot), more it’s a test of what
happens when branch predictors fail. In our case it shows our miss cost, ameliorated by the fact that
sometimes we can resolve a missed branch high in the commit Q (because we execute instructions
out of order) and refill it before it empties.
One thing I noticed in this benchmark is that it does one of the worst case things, a load followed by a
(possibly mispredicted) dependant branch, that sort of latency tends to slow a CPU’s pipe to a crawl.
Terrible if you find it in your program, but as a benchmark it’s excellent because we can look at it
and see if there’s anything here we can do to make things go faster …..
In this case it appeared that that previous load clock bug I’d found and fixed didn’t really apply, turns out
there a path there which could also be tightened up, it’s an interesting one because it’s all tangled up
in the logic that handles restarting mispredicted instructions …. it’s the sort of logic you can’t compile
into synchronous logic because it has circular feedback paths in it.
However it turns out that one
can tease apart the load completion logic and the “instruction is being killed” logic and effectively
speculatively complete the load, knowing that if the load instruction is going to be killed anyway there’s
another mechanism that going to do that a clock later, before the instruction is committed - the part of the logic this was entangled with also stops
a store Q entry being allocated for a killed instruction, that still needs to happen, but now it’s
unrelated.
(by ‘killed’ here we’re talking about the instructions following a mispredicted branch or a trap that need
to be cleared from the commitQ in order to restart the instruction stream)
So we got one less clock on a lot of instructions - how much faster is dhrystone now? The answer is none, 0%, no faster at all. As we
mentioned last week at this point dhrystone’s performance on VRoom! is essentially limited by its issue rate (the speed that the front
end can decode and issue instructions, and that’s limited by the branchy nature of the benchmark.
We issue bundles of instructions on 16-byte boundaries, so we can issue up to 8 instructions per clock
if they’re all 16-bit instructions and 4 if they are 32-bit (we’re operating on a mixture), also
whenever we branch into the middle of a 16-byte bundle, or out of the middle of one we have
to ignore the instructions not executed. Dhrystone is pretty ‘branchy’ it loses a lot to these issues -
currently we see an issue rate of 3.58 instructions per clock (max would be 8).
A while back we made an attempt to up issue rates by creating a trace cache (a level 0 virtual i-cache that holds
decoded instructions), that experiment was a bit of a failure, now that we’re starting to become
issue limited it’s probably worth reopening that particular can of worms ….
And possibly yet another Clock ….
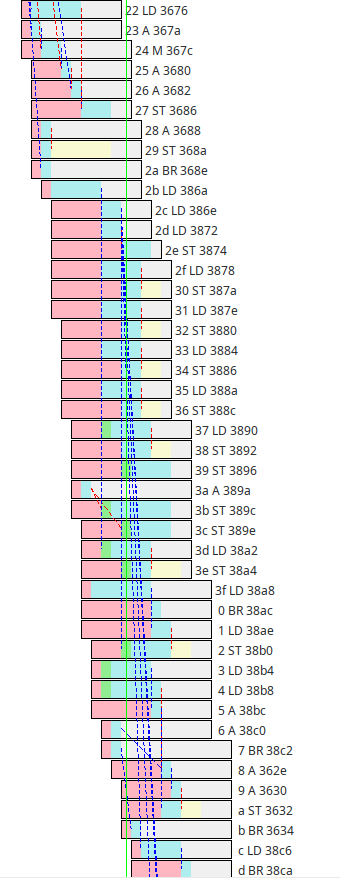
Here’s another trace from dhrystone:

It’s another case where the commitQ is pretty full - the interesting stuff starts at the top,
there’s a “2a BR 386a”, that’s a subroutine return followed by an indirect load from the GP. The
address read from there is then used as base address for another load and then those two addresses
are then used as the base addresses for a sequence of load/store pairs.
The load/store
unit is getting a great workout there, at times issuing 6 instructions/clock (for address
processing) and 4 each load/stores per clock (those vertical red dotted lines are the data
moving), what’s not so obvious is that there are load instructions there where the blue
portion is not 2 clocks wide … that means that they are waiting for store instructions
ahead of them for which we don’t yet know the address of (and therefore can’t yet be entered into
storeQ), because we don’t know the (physical) address these instructions will store to, the
following load instruction can’t bypass them in time because they might alias (ie the store instruction
might change the data the load instruction is trying to load).
Anyway looking at this closely we suspect that there might be an extra clock here for the case
where when the store resolves but the addresses don’t alias (when it does alias the load has to wait
until it can snoop the stored data from the storeQ).
However even if we hunt down this clock (it’s likely going to be a difficult timing path) benchmarked
performance likely won’t increase for all the reasons we’ve explained above.
The core instruction retirement rate here is also strange - it’s retiring 8 instructions per clock every
other clock (2f-36, waits a clock, the 37-3e, waits a clock, 3f-06, waits a clock, 07…), which is a bit strange and worth spending some time with.
Next step is going to be to build some more visualization tools to represent these relationships along side
the existing pipeline tool, there’s likely more subtly to understand.
Next time: More misc extensions
18 Feb 2023
Introduction
Last week we announced a new Dhrystone number 7.16 DMips/MHz at an average ~2.8 IPC (instructions
per clock) - we keep quoting DMips/MHz because it’s a great number for measuring what a particular
architectural implementation can do. IPC is more specific it tells us something about how our
particular architecture is doing - in our case we can peak issue 8 instructions per clock (if we have no
branches and all RISCV C (16-bit instructions), of course real instruction streams don’t do this - on Dhrystone we
measure on average ~3.5 (out of 8) instructions per 16 byte bundle. VRoom! can also retire a peak of
8 instructions per clock (this is limited by the number of write ports in the architectural register file) the
average IPC numbers we quote is the average of the number of instructions retired per clock.
Our IPC clock number is actually slightly low as a small number of instructions (mostly no-ops and
unconditional branch instructions) don’t make it past the decode stage, and so never get ‘retired’.
Our major microarchitectural tool has been a simple trace, it logs instructions entering commit buffers,
their execution and their retirement - it’s great for debugging pipe problems and particularly
pipe wedges.
What it doesn’t do is give us a lot of insight into when and why individual instructions
wait in the commit Q. Now we have a
new tool for exploring the pipe:

Each box represents an instruction, to the right is the commit Q index, the functional unit and the PC.
Instructions that align on the left were issued in the same clock (ie come from the same 16-bit fetch bundle)
instructions that align on the right are retired together (we never retire out of order, things retired together are committed together).
We can click on any instruction and see it hilighted (black), the instructions it depends on also
get hilighted (red and blue). Clicking back in time we can explore dependency chains.
Within each instruction we can explore why it’s being delayed, pink means it’s waiting for
other instruction’s to complete. Green means we’re short of functional units, blue means we’re executing,
yellow is for store instructions (which can start executing when the address is ready but wait for the
store data to come along), gray just means an instruction is done and it’s waiting for to be
committed (an instruction can’t be committed until all the instructions ahead of it are committed).
This is great - but it doesn’t (yet) show load/store dependencies - in our new load/store units
load instructions and store instructions get put into a temporary space if there are load/store
instructions ahead of them in the instruction stream for which we don’t yet known the address.
We allow accesses to different addresses to pass each other in the store and execution queues, but
until we know all the addresses we have to wait.
What are we waiting for?
It turns out that resolving those low level memory dependencies is important, more importantly
there’s a 3rd issue - we can issue 8 instructions per clock, and retire 8 (if they’re done)
but have a 32-entry commit Q - that means that really there are only 16 effectively active entries
in the middle of the queue.
We have 32 entries in out commit Q because we couldn’t fit any more into the AWS
FPGA test environment, we’d always expected to increase this to 64 or 96 entries (all those comparable
big CPUs in the field tend to have something of the order of 1-200 instructions in flight at a time so
we’d always expected to increase this) - by doubling the size of the commit Q we give more things
time to finish without causing stalls - with a 64 entry commit Q we can have ~150 instructions in flight
at a time (including the store Q).
The results are great, better than we expected: For Dhrystone our previous 7.16 DMips/MHz expands by ~22% to 8.71 DMips/MHz -
3.39 IPC. That’s pretty amazing - we know that Dhrystone, as we’ve compiled it for RISC-V, issues
instructions at an average of 3.52 instructions per 16-byte bundle (per clock) - since we can’t retire
more than we issue that means we only have about 4% more we can get from the execution unit, for
this workload they’re pretty well matched.
Note: there’s a lot of green in some parts of the above trace (and even more in other places), which implies
that we might perform better if we have 4 rather than 3 ALUs (‘green’ means an instruction is waiting for an ALU). We did do that experiment,
but it turns out that, like last time we tried it, the performance is identical (to the same number
of clocks),
even though the 4th ALU gets a lot of use there’s enough slack in the larger commit Q that instructions
get shifted in time but end up being retired at the same rate. So we’ll stay with 3 ALUs for the moment,
if we build a 2-way SMT version we’ll likely need to increase this to at least 4.
Of course Dhrystone is just one benchmark, and we’re pretty much done working on it, time to try
something different. It may also be a good time to revisit a trace cache (which will up the issue rate of
inner loops, and since Dhrystone is effectively perfectly predicted should up the issue rate to 8 instructions per bundle).
Next time: More misc extensions
11 Feb 2023
TLDR
After the past new work we went to spend some time just going over the core pipes
at the micro level looking to make sure we hadn’t broken anything - and found something
that’s been broken since we rewrote the load/store unit.
Essentially the commit units are usually able to predict when an instruction will
be completed one clock ahead of when its resulting data will be available to be bypassed so we can
schedule units dependant on that data for the next clock. Usually this is easy because
most instructions are of fixed length - but loads take a variable amount of time
and even though we know a clock before writing the loaded data back into the register file
we weren’t signalling - this is now fixed, it will be a difficult timing path.
Results - new Dhrystone numbers ~7.16 DMips/MHz - increased by ~6%
Pulling another ~11% more performance out of the design warrants some more exploration in this area,
we know that for the above benchmark we’re getting on average ~2.8 instructions retired per clock, but
the front end is decoding on average ~3.5 instructions per 16 byte bundle (per clock -
Dhrystone is very ‘branchy’ so it’s not really possible to write a faster decoder) - that means we
can estimate a potential top Dhrystone number of ~9 DMips/MHz, so we have about another 25% to find
in the execution side.
Off to work on some better pipeline visualization tooling, and to experiment with a 64 entry commit
queue (something intended for a real chip anyway).
Next time: More misc extensions

