19 Jun 2023
Introduction
Last time we talked about how we would approach building our RISC-V vector instruction implementation, here we’re going to talk a bit more about how we plan on doing it.
Background
We selected an initial design where the renamer
breaks each vector instruction into multiple beats - issuing cloned
copies of the instruction into the commitQ. This has the advantage that they can then be executed out
of order and be spread among multiple vector ALUs and be executed in parallel wherever possible.
Remember that a RISC-V vector instruction essentially has two parts - an instruction, and a
separate length/shape
that describes how it’s executed - so you might set up a shape of “‘32-bits’ length = 45” in a register the vector
unit will execute 45 32-bit adds - on a 512-bit implementation it would fit 16 32-bit values into a register and as a result 45 32-bit entry vector will fit into (45=16+16+13) 3 512-bit SIMD registers.
So we can do a 45 entry 32-bit vector add in 3 clocks - the RISC-V vector architecture makes it easy to write
portable code that runs on 512-bit, 256-bit, or even 64-bit register systems without change.
We’re going to use this example (a 45 length 32-bit operand 3 register operation) in all our diagrams
below - in reality individual operations can be from 1-8 registers in length, and the way that
register length fields are managed makes it easy
to create loops that process much longer vectors of arbitrary length.
Implementation
We expect (with a few exceptions like division and sqrt) each vector instruction that reaches a vector ALU
will be executed in a fixed number of clocks (likely 1 for integer ALUs, 2 for multipliers, 2/3 for floating point add/multiply) - splitting these up into individual units makes scheduling easier (and more efficient).
The register files here are going to be big - 32 architectural and likely 64 in the commitQ buffers, for
routing reasons we’ll not share the commitQ buffers with the integer/FPU ALUs it’s better to keep those registers near the ALUs they feed. Remember our ALU designs are intended to be regular, amenable to hand
layout/routing - so we don’t work too hard on the verilog models other that as a synthesisable example for correctness
and testing we want the real thing to be fast.
The register width in this design is variable (as a compile time variable - verilog generate FTW) - for the moment any power of
two between 64 and 512 (512 is our the cache line size, architectures larger than that will need
extra load/store unit work) - we’ll be testing with 512-bits.
Examples
The main point of this blog entry is to crystalize some of the design patterns we’re going to use for
what we’re going to call the VRE (‘vector renamer expander’) which is the unit that’s going to expand
individual vector instructions into multiple ‘beats’ or simple ALU instructions
1. A simple example
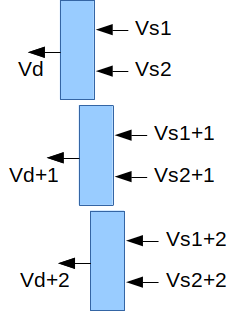
Consider a simple vector add instruction ‘vadd.vv vd, vs2, vs1’ this along with the current vector length register really mean that it is effectively N SIMD register adds - if N is 3 then we’re going to break these up into ‘vadd vd, vs2, vs1; vadd vd+1, vs2+1, vs1+1; vadd vd+2, vs2+2, vs1+2’ - our renamer can throw these into the commitQ as 3 entries, because their source registers are independent of their destination registers
they can be executed out of order (only limited by when their source registers become available).
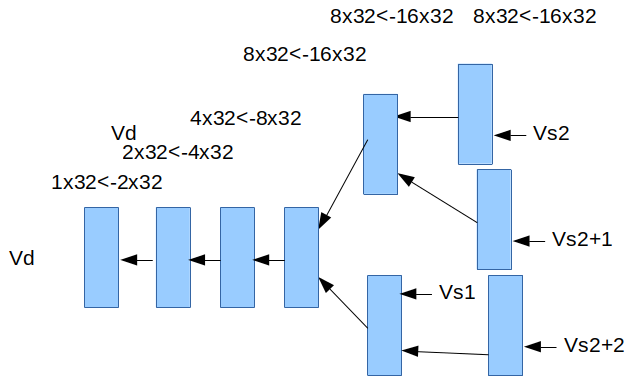
Partly here we’re trying to explain the relationships that renamed vector registers are going to end up
having - blue boxes below represent individual commitQ entries, arrows represent register dependencies,
(if Vs1 is register V4, Vs1+1 would be V5). Individual commitQ entries will be mapped to real vector
ALUs when all their registers become available, if there’s no dependency relationship between blue
boxes they can be executed in any order.

2. A more complex example
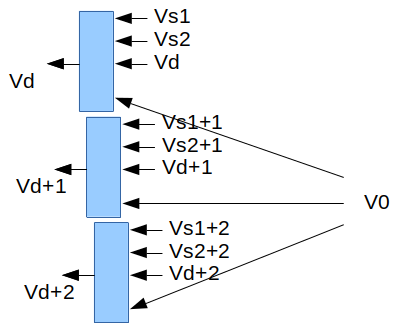
Most RISC-V vector instructions have an optional bit mask that enables whether or not a particular field is
operated on or not - in some cases unmasked fields (in the destination register) retain their original
values. Implementing this means reading the previous value of the destination register, and the bit mask
registers which is always in register V0.

This gives us the general ‘shape’ for each functional unit - a write port and 4 vector read ports (actually
an integer or FP read port too) - there’s some scope for simplification of the mask read port - it always
reads architectural register V0, but still needs to be renamed like any other register.
3. Widening
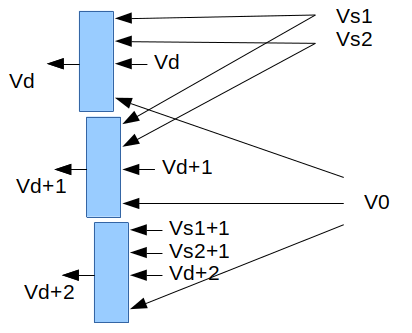
There’s a class of instructions that convert data of one size to data of twice that size, for example “vwadd vd, vs2, vs1, vm” might add together two 16-bit values to make 32-bit ones.
These instructions need to fetch source registers at half the rate - they’re going to look like this:

4. Narrowing
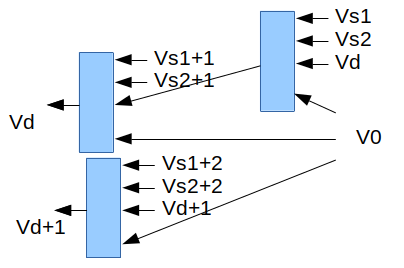
There’s a similar set of operations where data of one size is narrowed to another - for example from 32-bits down to 16-bits. In this case we need to read data from two registers to make each output register, in this case the renamer needs to be able to make dependency graphs that look like this.

Notice how we now have a dependency where we didn’t have one before - we need to create Vd, but it needs to read two sets of registers and so it needs two clocks (two ALU slots) to get the register file bandwidth to
be executed. The upper 2 blocks each write register Vd, but to non-overlapping portions of it (they could be done in either order).
More examples
There are lot of patterns for different instructions, we’re not going to cover them all today, but let’s
talk about a couple of the more interesting that we’re still thinking about:
Many-to-one patterns
There’s a class of vector instructions that perform an operation on all the values in a vector to
produce a single result, for example: vredsum.vs vd, vs2, vs1 adds up vs[0] and all the values in vs2[*] to make a single scalar sum that is deposited into vd[0].
If we have vector ALUs that can add N 64-bit (or 32-bit) values in a clock - then with 512-bit registers and our 45 entry 32-bit example we can add 16 32-bit registers from a register to make 8 32-bit sums, we can then add 2 registers each with 8 32-bit sums to make 1 register with 8 32-bit sums ….

As you can see this sort of pattern tends to have a log2 N sort of depths of structures, only the early portions of the process can be parallelized.
Random access patterns
There a small number of instructions that essentially randomly access values in another
vector - in a system that renames registers this is a particular problem and may result in stalling the renamer, consider
the vector gather operation that takes a vector of offsets to select entries within another vector,
it’s essentially for i Vd[i] = Vs2[Vs1[i]] - the renamer has to rename each Vs1 (remember a vector might be
45 items long but only stored in 3 registers, it’s the registers that are renamed), then get something into the commitQ that reads the renamed Vs1 register, when that’s done the renamer needs to be able to rename the indexed Vs2 register and put that into the commitQ to write the final Vd output - these will probably need to be done entry by entry, there’s not a lot of parallelism available here - gather instructions are likely
going to need work to stop them becoming bottlenecks. (There’s still lots of work to be done here)
What’s Next?
More work on integer ALUs, a modified renamer.
Next time: More Vectors!
05 Jun 2023
Introduction
We’ve started work on our vector support, trying to figure out how to fit it into our existing
design, this blog entry is about a couple of possible ways to implement RISC-V’s vector instruction set
on VRoom! and the tradeoffs between them.
Background
First a reminder of how our basic architecture works:

Instructions are decoded, renamed and the inserted into the commitQ. ALUs are assigned to instructions
from the commitQ when they’re ready (when the registers they use are available), they’re executed
out of order, but instructions near the end of the queue get priority. Instructions are taken from
the end of the commitQ when they are ready to be committed (all instructions prior them will also committed)
then their results are written back to the architectural register file.
A vector implementation will likely have multiple vector ALUs, possibly of different types depending on the throughput we want to target.
RISC-V’s vector instruction set is different from the one in most mainline CPUs, some have compared
it more with Cray’s vector instructions. The main difference is that each instruction may operate on a
variable sized range of vector registers (or memory locations) - a simple add might be a SIMD add of registers V1-V3 to V4-V6 leaving the result
in V7-V9 - there are architectural registers that describe how long a vector is, and support to automatically
split vectors up into architecturally meaningful chunks. With this ISA we can run out
of architectural vector registers pretty fast (there are 32) quite fast, the commitQ’s large number of associated
renamed registers is a big advantage here, it means we can be working on far more registers at once.
There are also new architectural registers that describe the length (and shape) of vectors for subsequent instructions,
to build an out-of-order system they need to be renamed and/or predicted in some way.
Design 1 - multi-cycle instructions
The first design we looked at issues vector instructions to the vector ALUs and expects them to execute
multiple beats (clocks) worth of execution depending on the vector length. Instructions would be issued
to ALUs when the first register comes ready and would stall if subsequent registers are not available. Multiple vector ALUs could dynamicly form pipelines.
Advantages:
- relatively simple
- vector length handling is easily renameable
Disadvantages:
- renamer needs to be able to represent ranges of registers
- beats must be done in order
- stalls badly on a cache miss, no other instruction can be scheduled to that ALU until it’s done
- throughput is low (load/store unit can load/store 4 registers per clock but a vector unit like this would retire 1 register per clock)
- retiring instructions becomes harder (one instruction might use more write ports than the transfer pipe has available)
- commitQ entries need to be able to hold multiple uncommitted instruction results
Design 2 - renamer breaks instructions into beats
In the second design we have the renamer break each vector instruction into multiple beats - issuing cloned
copies of the instruction into the commitQ. This has the
advantage that they can then be done out of order and spread among multiple vector ALUs and be executed in parallel.
Advantages:
- ALU use is per register, much more like how everything else works today
- more parallelism available, we can do multiple parts of an instruction in parallel
- everything can be aggressively out of order
- load store unit can read/write multiple registers per clock
Disadvantages:
- renaming the length information is much more difficult - we will need to know it before the renamer can progress - sometimes this will be easy, sometimes the renamer will have to stall until the value has been calculated (when vset gets executed)
- renamer becomes messy - probably becomes a 2-clock process at higher clock speeds (we’ve long though this was likely anyway)
What’s Next?
Initially we’re going to implement the second option, probably with some vector length prediction hardware
(a bit like a BTC mixed in with some knowledge of how “strip mining” normally works).
So probably decode, a simple adder ALU and the renamer work to feed it.
Next time: More Vectors!
17 May 2023
Introduction
We’ve been working on the Trace Cache - if you read back a couple of blog entries you
will remember that it was performing better than not having a trace cache - but suffered
from mispredicted branches (while equivalent non trace-cache cases didn’t).
Now we’ve upgraded the trace cache to include some local prediction history - it gives us another 10%
performance bringing our Dhrystone number up to 11.3 DMips/MHz
Trace Cache
Our original trace cache had N (N=64) lines of I (I=8) instructions. Each cache line has 1-8 instructions
and a ‘next instruction’ entry telling the PC controller where to go next. We terminate filling a line
when we find a subroutine call or return - because we want to keep the branch predictor’s call/return
predictor up to date and use its results on returns.
In essence each line already has some branch prediction capability, it predicts all the branches
in the line (a line could be up to 8 branches), and predicts where the last instruction jumps to (or
what instruction it is followed by).
So the problem we’re trying to solve here is: for each trace line where sometimes it runs to completion and
sometimes it takes a branch from the middle (or even the last instruction) of the trace line what happens?. What we need to predict are:
- Which of the first J or the I instructions in the line will be executed
- What will be the next instruction to execute after the Jth instruction is executed
Our normal (non
trace) branch prediction uses a dual predictor that predicts either from a global branch history
or a simple bimodal predictor - we essentially already have the simple predictor in place in our trace line
that predicts a
next instruction address, and that all the valid instructions in the line will be executed.
What we’ve done is added a local predictor history to each cache line, it’s M (initially M=5) bits updated
on every fetch and every branch misprediction, 1 if the prediction should be taken and 0 if it wasn’t.
For every line we also have A (initially A=2) sets of <next instruction, num of instructions to issue> tuples, each set also has B (initially B=4) sets of histories and 2-bit counters. Essentially if the line hits in the cache then if its local history mask matches one of the masks and its associated counter isn’t 0 then we
predict a non-default branch and that it’s destination is from the associated <next instruction> and only the associated
<num of instructions to issue> are issued - otherwise the entire line and the default next instruction
is used.
History masks, counters and <next instruction, num of instructions to issue> tuples are allocated on
mispredicted branches - counters are incremented on correct predictions, and decremented on
mispredictions, and slowly decay if not used over time (as do trace cache entries themselves). If a <next instruction, num of instructions to issue> set runs out of history masks to allocate then another <next instruction, num of instructions to issue> tuple with the same results can be allocated.
Having multiple <next instruction, num of instructions to issue> tuples per line is intended to handle the case
of a line with multiple mispredicted branched in it - something like a decision tree in a case statement
or the like - all this stuff is parameterized - it may turn out that after a lot of simulation we find out
that that doesn’t happen much and maybe we just need A=1 (one next address/etc) but a larger B (more masks)
and/or larger/smaller masks.
Results
On our dhrystone benchmark we now get 10% more performance - we see an issue rate of 11.31 DMips/Mhz - another 10% more
performance above our previous results. We’re seeing an issue rate for 6.12 instructions per clock but
are executing 4.15 instructions per clock (IPC). This is with 3 ALUs, if we instantiate 4 ALUs performance
increases by a tiny fraction of a percent, by itself not really worth doing. Theoretically if we can get
the execution rate to match the issue rate we’d see a DMips/Mhz ~16-17 - another 50% more performance.
Why aren’t wee seeing this? largely it seems to be because of stalls in the memory subsystem, mostly
loads and stores waiting for stores that haven’t resolved their addresses yet - there are various ways
to potentially resolve this issue, mostly speculative loads that might cause cache activity and as a result
leave us open to Meltdown like security issues - we’ve been pretty conservative in this area and probably
wont return to this issue for a while.
Despite this >4 IPC is pretty amazing, 4 IPC was our initial goal for carefully crafted media/etc
kernels, exceeding it with branchy, compiled C code is great!.
it with
Dhrystone has also been done to death here, it’s been useful because it’s helped to balance our
fetch/decode and execution stages, next time we do serious benchmarking we’ll probably build
a much wider range of tests (we need to tweak the FP performance for example).
What’s Next?
It’s time to work on a vector ALU(s) - we have all the components in place and a core that
can feed them efficiently.
Next time: Vectors!
04 Apr 2023
Introduction
The last couple of weeks we’ve been running and writing regression tests - found some interesting bugs ….
Our current full regression testing regime takes ~18 hours.
Trace Cache
The hardest problem to track down was in one of the generic RISC-V compliance tests - the test ran
OK and generated the correct output, but the actual output phase generated an extra new line
between each line of output.
This turned out to be a trace cache related bug - each trace cache line includes a predicted next address,
usually this is simply the address of the next instruction after the last instruction in a line, or if
the last instruction is a branch then it’s the target of the branch. In trace cache lines that include
subroutine calls and returns we cut the trace cache lines short so that the BTC’s call return stack can be kept up to date, in these cases the last instruction in the line is the call or return.
In this case the problem instruction was a relative subroutine call (not one done
indirectly through a register) - this is a unique case - in our design there are two sorts of
unconditional jump instructions:
subroutine calls that go into the commit queue because they have to write a return register
and normal unconditional branches that are effectively swallowed by the fetch/decode stage and
never reach the commit queue (they don’t even get counted when we report the number of instructions executed,
or IPC numbers - we’re actually slightly faster than we report because of this).
Why was this instruction different? well as we pass an instruction bundle through the machine we carry with every branch instruction the predicted address of its target, initially we just used this for triggering BTC misses,
but when we implemented the trace cache, we also started using this to generate the trace cache’s predicted
next address. It turns out that for relative unpredicted jump instructions the program counter unit was generating
the predicted address incorrectly, prior to using it for the trace cache it was being ignored (because the
branch unit doesn’t need to check if an unpredicted branch branched to the correct place). This was
one of those cases where the failure occurred a few million clocks after the actual bug.
Instruction Fusion
Found an interesting bug in instruction fusion - we weren’t handling 64-bit addw vs. add correctly when
merging an add instruction with a subsequent branch (in this case a subroutine return). This was an
easy bug to find and fix but reminds us that once you start fusing instructions testing starts to
have an N squared sort of behavior - if we get serious about instruction fusing we’ll have to generate
a lot more tests.
On previous CPUs we’ve worked on we’ve had someone generate enormous quantities of random
instruction streams (especially good for stressing pipelines), as well as streams of instruction
pairs, we’re probably going to eventually need
tools like this.
VMQ overflow
A few months back we rewrote the load/store unit to add much more parallelism - it now processes everything
in 2 clocks and handles 6 address translations and 4 each load/stores at once - one area we didn’t touch
was the Virtual Memory Queue (VMQ) - this is a structure that queues TLB misses to the second level
TLB cache and table walker, it has 12 entries and worst case it must be able to accept 6 TLB misses per
clock. If the queue fills commit Q instructions much be able to back off and try again.
We had a stress test for this, but after the load/store unit rewrite it stopped forcing VMQ overflows,
now we have a test that does that and we found new bugs caused by the rewrite, luckily we were able to find a bug fix
with fewer/faster gates than the previous logic.
What’s Next?
Going to spend some more time with the trace cache.
Next time: More trace stuff
11 Mar 2023
Introduction
Last week we found some Dhrystone performance we’d left unreported from when we had implemented
the B instructions, but largely for a couple of months now our performance has been limited
by the issue rate in the fetch/decode stages, in Dhrystone this is limited by the branchy nature of the instruction
stream.
This week we resurrected our broken trace cache and got a further 5% performance (now at 10.3 DMips/MHz)
Trace Cache
Last year we spent quite a while building a simple trace cache for VRoom! the experiment
was successful in the sense that it actually worked, but not so much because its performance sucked,
it never performed better than not having a trace cache.
So what is a trace cache in this context? essentially it’s a virtually tagged cache of already decoded
instructions recorded from the spot in the CPU where we retire instructions - in particular it’s a
recorded stream of post branch predictor instructions - our trace cache is 8 instructions
wide and is capable of feeding fully 8 instructions per clock into the renamer.

As mentioned above our previous experiments of creating a simple trace cache sucked, mostly
that was because it interacted badly with the branch target cache (BTC) - when we use the BTC alone
Dhrystone is predicted perfectly, when we mix it with a trace cache we see mispredicted
branches and the associated performance drain.
So now that we’re in a position where we’ve been improving the execution side of things
for a while, but not the issue side of things, so it was worth revisiting the broken trace cache,
to our surprise it performs better than not having it now - we now see ~10.3 DMips/MHz which is
~5% faster than last week’s numbers - even with the broken trace cache taking mispredicted branches.
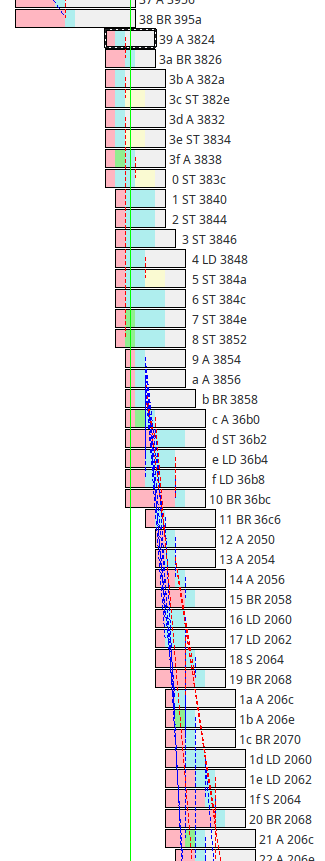
Here’s a great example trace from the middle of Dhrystone:

Note that it starts with mispredicted branch, but after that we see a bunch of mostly full feeds from
the trace cache - runs of 8 instructions all starting on the same clock.
In fact we measure an
issue rate of 6.2 instructions per clock over the benchmark (previously we were getting ~3.7)
sadly though, many of those are being discarded by mispredicted branches (which flush all the instruction
after them in the commitQ when they resolve), our final IPC (instructions
per clock, which is a measured after branch prediction, a count of actual instructions completed) is now at 3.77 (out of 8) - our design goal has
always been 4 on sustained streams, that we’re getting this close on a branchy benchmark is pretty
amazing!.
What’s Next?
It’s pretty obvious that we need to fix the trace cache and up the issue rate - next step is likely to be
to have the BTC learn to predict whether a trace cache hit should be followed or not
Next time: More trace stuff
